
Understanding the Fracture Surface
To fully grasp the fracture process, it's essential to understand how cracks initiate and propagate through a material. These mechanisms can be revealed by closely examining the fracture surface. In most cases, detailed optical microscopy clearly highlights the key features, offering valuable insights into the origin and progression of the failure.
Fracture Surface Analysis: Failed Polycarbonate Boss
Optical microscopy of the failed polycarbonate boss reveals three distinct fracture regions, each highlighting a different stage of the failure mechanism.
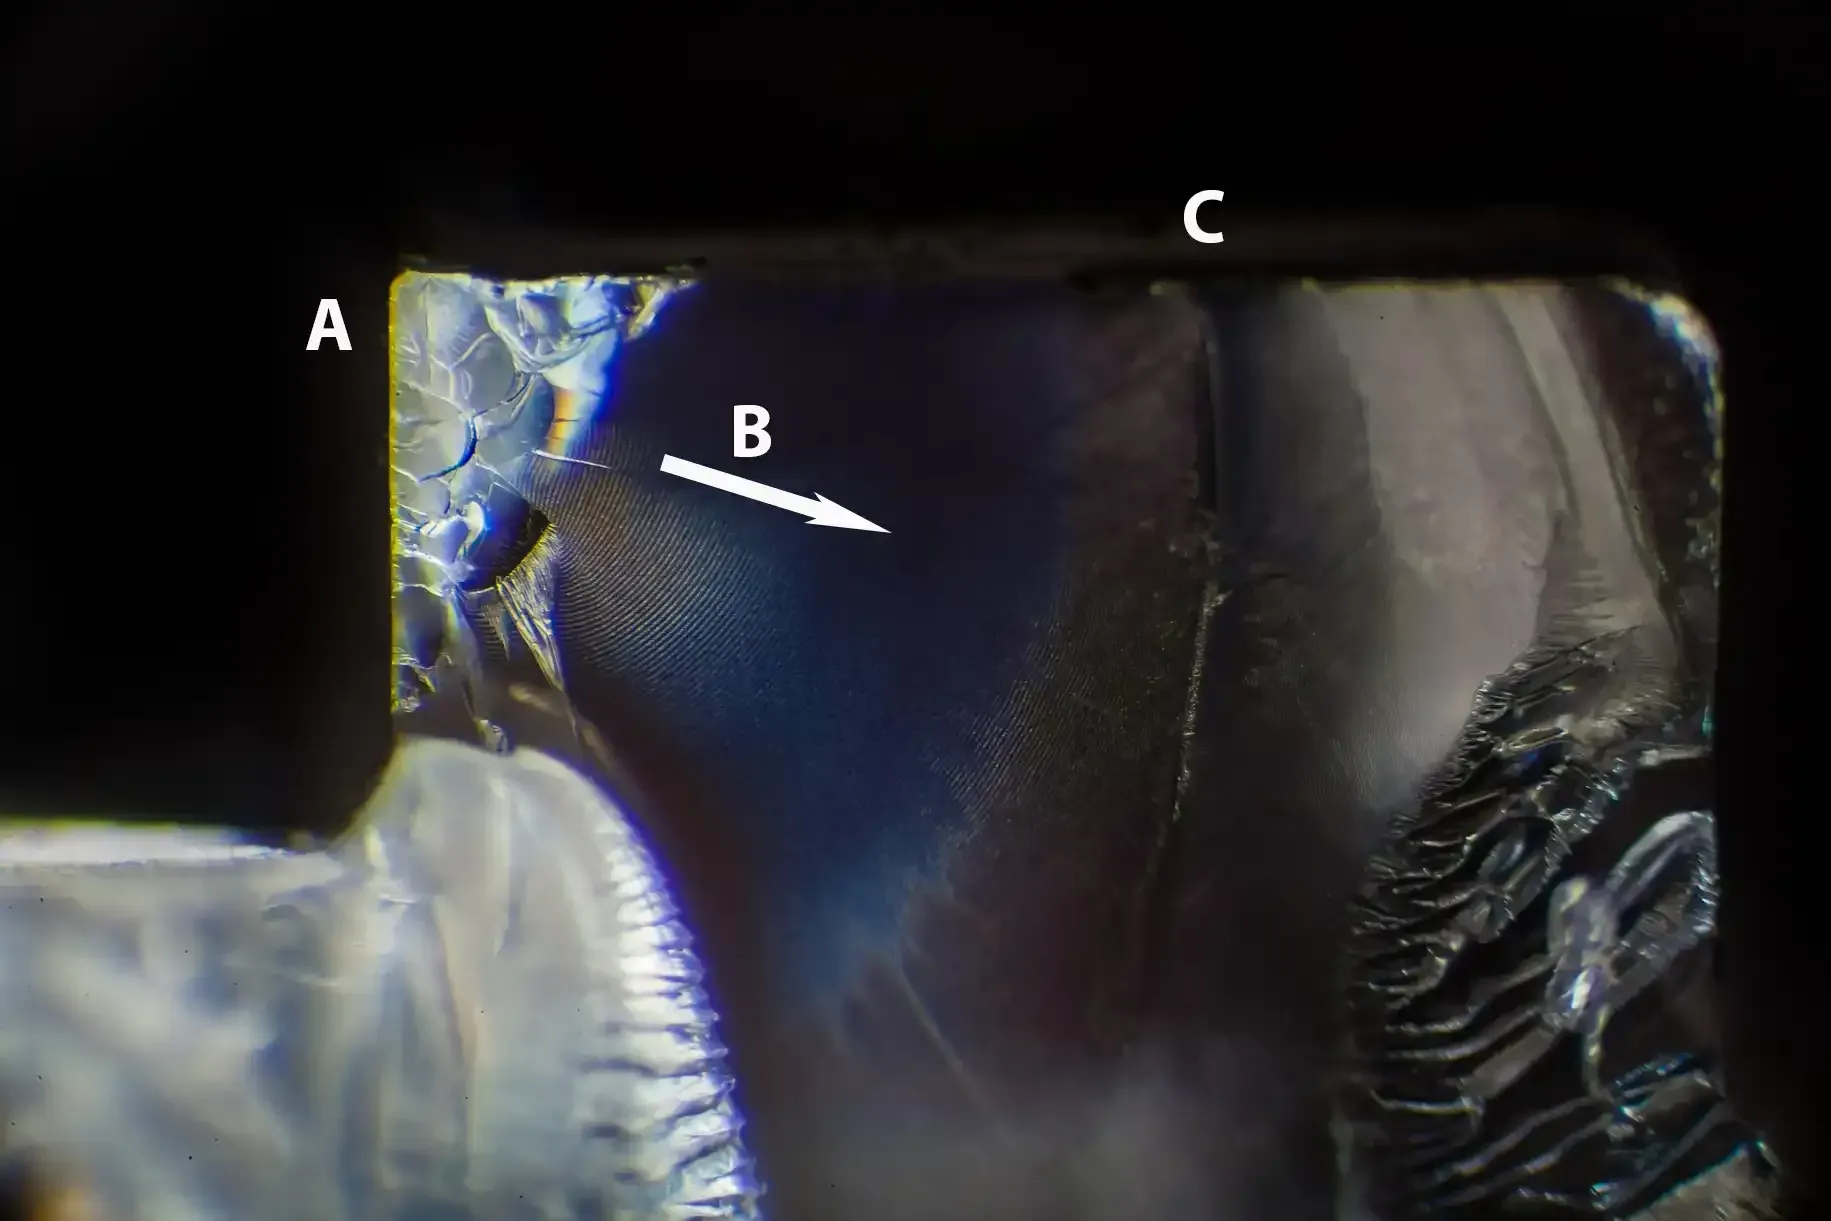
Region A: Crack Initiation – Environmental Stress Cracking (ESC)
The internal surface of the boss (Region A) displays an uneven texture with overlapping cusp-shaped features. This area corresponds to the contact zone with a nitrile washer used to seal the lens unit. The overlapping cusps suggest multiple crack initiation sites—a characteristic indicator of environmental stress cracking (ESC), in this instance caused by migration of plasticisers from the nitrile rubber.
Region B: Fatigue Propagation – Thermally Driven
Radiating outward from the initiation zone are fine concentric striations (Region B). These lines reflect fatigue-driven crack propagation, with thermal cycling as the driving force. The crack advances when the light is switched on and arrests when it’s off, producing the characteristic striated surface.
Region C: Final Fracture – Critical Crack Growth
As the crack reaches a critical size (Region C), the fracture surface changes dramatically. The crack propagates through the full thickness of the boss in two or three rapid movements—likely triggered during handling of the component